How to Measure Operational Efficiency in Philippine BPO Teams – With Benchmarks
Analyzing operational efficiency is one of the most important – and most frequently mismanaged – disciplines in operations management that Philippine organizations and global teams face today. Most operations leaders know their teams are busy. Far fewer can demonstrate, with data, that those teams are genuinely efficient.
Let’s be honest – most operations teams are flying blind. Ask any operations manager in the Philippines how their teams are performing, and you’ll get one of two answers: a confident “we’re doing well” backed by gut feeling, or a frustrated “I honestly don’t know” followed by a stack of spreadsheets that raise more questions than they answer. Neither helps you run a better operation.
The Philippines has become one of the world’s most important hubs for business operations. The IT-BPM sector closed 2025 with export revenues exceeding $40 billion and a workforce of 1.9 million professionals, contributing over 8% of GDP.¹ Global Capability Centers are expanding fast across Metro Manila, Cebu, Clark, Iloilo, and Davao. The pressure to deliver measurable efficiency gains has never been higher.
The problem nobody talks about enough: being busy and being efficient are not the same thing. Teams can be fully occupied and still be massively inefficient. Without the right data, you’ll never know the difference.
This guide walks you through a practical, step-by-step approach to analyzing operational efficiency – and measuring whether your productivity initiatives are actually working.
What Is Operational Efficiency? A Working Definition
Operational efficiency measures how well an organization converts its inputs – time, labor, and resources -into productive outputs. An efficient operation delivers the same or greater output with fewer resources, less waste, and less rework. The key distinction: efficiency is about how you work, not just how much you work.
The efficiency formula: Operational Efficiency (%) = (Useful Output ÷ Total Input) × 100
Efficiency and productivity are related but different: efficiency asks whether work is done without waste; productivity asks how much output is generated per unit of effort. A team can be highly productive but inefficient – delivering volume by burning through resources unsustainably. The goal is both.
Traditional vs. Outcome-Based Measurement in Operational Efficiency
| Dimension | Traditional Measurement | Outcome-Based Measurement |
|---|---|---|
| What is measured | Hours logged, attendance | Output per hour, cycle time, utilization rate |
| Focus | Presence and activity | Results and value delivered |
| Insight quality | Low – shows effort, not efficiency | High – surfaces waste, bottlenecks, capacity gaps |
| Best for | Compliance and payroll | Continuous improvement and ROI tracking |
IBPAP full-year 2025 data, as reported by The Manila Times, Philippine Daily Inquirer, Philstar, and the IBPAP Official Newsroom.
Step 1: Stop measuring hours. Start measuring how work actually happens.
Before you can improve efficiency, you need real visibility – not just who was logged in from 9 to 6, but what they actually did: which applications, how long tasks took, and where handoffs between teams quietly fall apart.
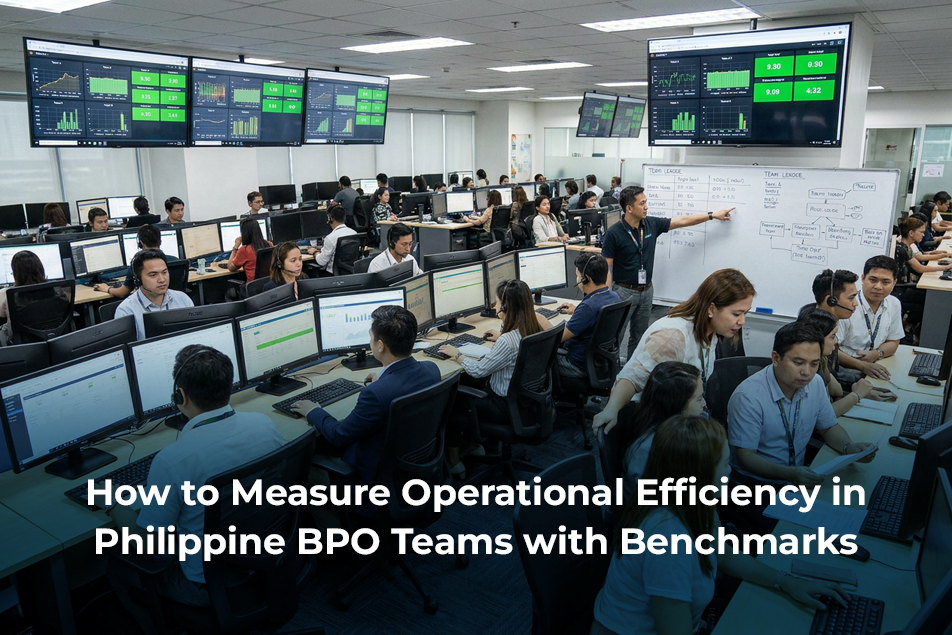
The solution is an automated measurement system that captures how time is actually spent – across active work, breaks, idle periods, and specific applications – without manual input or timesheet chasing. The right platform surfaces this in dashboards operations leaders can act on within days of deployment.
ProHance product specifications including 0.43 kbps bandwidth requirement, 24-48 hour setup, 72-hour report availability, Windows/macOS/Citrix compatibility, and ISO 27001/SOC 2/GDPR/HIPAA compliance.
Step 2: Define what “efficient” actually looks like for your team.
This is the step most organizations skip — and then wonder why their improvement efforts don’t stick. Efficiency isn’t a universal standard. What it means for a finance processing team in Makati is different from what it means for a healthcare back-office team in Cebu.
The metrics that typically matter: time utilization (productive vs. non-productive time), output per employee per shift, cycle times for key processes, workload distribution across team members, and whether people are using the tools they’re supposed to be using. Configuring these into your measurement framework – connected to real operational data – is what turns good intentions into actual decisions.
Key Metrics for Operational Efficiency: Benchmarks and Targets
| Metric | What It Measures | Benchmark / Target Range | Why It Matters |
|---|---|---|---|
| Active Utilization Rate | Proportion of shift time spent on productive work vs. idle/break | 70–80% healthy; below 65% signals a structural issue | Most direct indicator of efficiency – gaps reveal task allocation and handoff problems |
| Output per Employee per Shift | Volume of work completed per person per shift | Set against your own top-performer baseline | Connects time data to actual output – the gap basic time-tracking tools miss |
| Average Cycle Time | Time to complete one unit of a key process end-to-end | Track trend vs. target; flag when consistently over SLA | Identifies where processes are slowing and where bottlenecks sit |
| SLA Adherence Rate | % of tasks completed within agreed service levels | 95%+ for most BPO and GCC operations | External-facing measure of reliability; impacts client retention directly |
| Workload Distribution Balance | Variance in task load across team members in the same function | Low variance = well-distributed; high variance signals overloading | Uneven distribution causes burnout in high performers and idle time in others |
| Tool and System Utilization | % of time employees spend in the correct systems for their role | Role-dependent; gaps indicate training issues or non-compliance | Validates whether process design is being followed |
| Productivity Gain Rate | % improvement in output per hour after a process or tools change | 15-30% within 3 months is achievable with the right visibility tools | The ROI proof point – demonstrates whether improvement initiatives worked |
Step 3: Find where the bottlenecks are actually hiding.
Once you have data, the next question is: where is work getting stuck? A lot of efficiency analyses fall short here — they look at individual performance and miss the fact that the real problem is in the process, not the person. A bottleneck at a handoff point between two teams can wipe out hours of productivity every day and never show up in anyone’s performance score.
Map your key processes and track task movement across teams. When you can see exactly where work stalls, which steps consistently blow their time estimates, and which teams are waiting on upstream work, you stop guessing and start fixing.
Step 4: Compare teams – because context is everything.
One team at 80% SLA adherence looks very different depending on whether the team next to it is at 95% or 60%. Effective benchmarking requires comparing performance by location, shift, function, and time period simultaneously. The most useful benchmark is usually your own best-performing team — if one team hits 78% utilization and another doing the same work sits at 59%, that gap tells you more than any industry average. For operations across multiple Philippine cities or split between on-site and work-from-home, cross-location benchmarking surfaces the teams doing things right and makes it possible to replicate what they’re doing everywhere else.
Step 5: Connect time to output – this is the part most tools miss.
Tracking how long someone worked tells you nothing about what they actually produced. An employee can be active for eight hours and have processed ten transactions; another working the same hours processed forty. Both look identical on a basic time-tracking tool.
ProHance’s Work Output Module solves this by integrating your business metrics — transactions processed, tickets resolved, documents reviewed — directly into the platform alongside work time data. The result is a live productivity ratio that actually means something: output per hour, per team, per shift, compared across time. Clients using ProHance have reported productivity gains of 15–30% within the first three months of deployment.³
ProHance-reported client outcomes as listed on SourceForge and Slashdot Software.
Step 6: Track improvement over time – not just in a snapshot.
There’s a habit in operations management of running a big efficiency review, implementing some changes, and then going quiet for six months. By the time the next review happens, half the gains have eroded and nobody knows why.
Real productivity improvement requires continuous measurement. Track utilization rates, cycle times, and output ratios consistently over time so you can see whether the changes you made held, whether new inefficiencies crept in, and where the next opportunity sits. That’s how you demonstrate ROI to leadership.
Step 7: Build in continuous improvement – not just periodic reviews.
The organizations that consistently outperform their peers don’t treat efficiency as a project. They treat it as an ongoing discipline. That means tracking core KPIs continuously, creating accountability at the team level so managers don’t wait for a quarterly analysis to act on a visible gap, and having the data infrastructure to distinguish between a temporary volume spike and a structural efficiency problem.
For Philippine BPO and GCC operations, this ongoing measurement discipline also provides the data needed to demonstrate consistent performance to parent organizations — which directly influences how much work gets allocated to a center and how much investment it attracts.
Choosing the Right Platform: What to Look for in Operations Analytics
Not all workforce analytics platforms are built for the complexity of enterprise BPO or GCC operations. The criteria that matter most for Philippine operations contexts: low bandwidth requirements (critical for delivery centers with variable connectivity), Citrix compatibility, multi-location benchmarking, compliance certifications (GDPR, HIPAA, ISO 27001, SOC 2) for international clients, and fast deployment – because a months-long implementation just adds to the problem you bought it to solve.
ProHance meets all of these criteria. It was purpose-built for enterprise operations management – connecting work time to output, linking processes to performance, and giving every level of the organization the visibility it needs to make better decisions. It’s trusted by 400,000+ users across 30+ countries,⁵ deploys in 24–48 hours with reports available in 72 hours,² supports Windows, macOS, and Citrix,² and is certified ISO 27001, SOC 2, EU GDPR, and HIPAA compliant.²
In 2025, Everest Group named ProHance a Major Contender in its People Analytics Platforms PEAK Matrix® Assessment – an independent evaluation across 23 global platforms.⁶ The recognition specifically called out ProHance’s real-time productivity visibility and its normalized view of output across diverse worker categories.
ProHance user milestone as announced in EINPresswire – “ProHance Achieves 400,000 Users Worldwide” (February 25, 2025).
PR Newswire – Official Everest Group PEAK Matrix® Press Release (May 13, 2025).
Key Takeaways
Operational efficiency isn’t a metric – it’s a practice. It requires consistent visibility into how work actually happens, a clear connection between effort and output, and the discipline to measure improvement over time rather than in one-off reviews. The organizations getting this right in the Philippines aren’t doing anything mysterious. They have better data, they act on it faster, and they’ve built measurement into how they manage – not just how they report. ProHance is built to make that possible.
Frequently Asked Questions
How do I analyze operational efficiency across teams in the Philippines?
Start by getting reliable data — which is harder than it sounds when you’re managing teams across multiple sites and shifts. A platform like ProHance captures how time is actually being spent in real time, with pre-built reports so you’re not starting from scratch every month. Once you have clean data, comparing teams against each other is where the real insight starts.
How do I measure operational productivity improvements?
You need a number that connects time to output — not just hours logged, but actual work completed per shift, per team, per week. Set that baseline before you make any changes, then track whether it moves. The mistake most teams make is judging success by how a change felt rather than what the numbers show. ProHance’s Work Output Module links activity data directly to output metrics, giving you a clear before-and-after read on every improvement initiative.
What is a good operational efficiency benchmark for BPO teams in the Philippines?
For back-office BPO and GCC teams, a utilization rate of 70–80% per shift is generally healthy. Below 65% consistently usually means something structural is off — task allocation gaps, handoff delays, or people waiting on upstream work. That said, the most useful benchmark is your own best-performing team. If one team is at 78% and another is at 59% doing the same work, that gap tells you more than any external benchmark.
How do I reduce idle time in back-office operations?
Idle time is almost never a people problem. It’s a process problem. It tends to show up in the gaps — between task assignments, at handoff points, when someone finishes a batch and nothing is queued yet. ProHance’s Work Time Module shows idle periods in real time, and the Workflow Management Module maps exactly where work stalls most often. That’s where you intervene — at the design level, not the individual level.
What metrics should I track to improve team productivity in the Philippines?
The five that matter most: active utilization rate, output per employee per shift, average cycle time, SLA adherence by team, and workload distribution. None is particularly useful in isolation. Where it gets interesting is tracking them together over time — because then you can see whether a dip in SLA adherence is a capacity issue, a process issue, or just a short-term volume spike.
What is the difference between operational efficiency and operational productivity?
Efficiency is about how well you’re using time and resources — are people working without unnecessary waste? Productivity is about what that effort produces — how much output are you getting? You can have a team that’s perfectly efficient but not very productive if they’re focused on the wrong tasks. The goal is to improve both, which requires connecting time data to output data — exactly the gap ProHance closes.
How does ProHance differ from basic time tracking software?
Time trackers tell you someone was logged in from 9 to 6. ProHance tells you what they were actually doing — which applications, which tasks, for how long, and how that compares to teammates. It connects activity to output, maps workflows to surface process breakdowns, and benchmarks performance across locations and shifts. For an enterprise managing hundreds of people across multiple sites, the difference is significant.
What should I look for in a platform for workforce analytics in Philippine BPO or GCC operations?
Bandwidth requirements matter more than they seem — not every Philippine delivery center has rock-solid connectivity, so a tool running on 0.43 kbps² is a practical advantage. Citrix compatibility matters if your GCC runs virtual desktops. Multi-location benchmarking is essential for teams across Metro Manila, Cebu, Iloilo, or Clark. And GDPR/HIPAA compliance is non-negotiable for international clients. Fast deployment is also worth prioritizing — a months-long implementation means the problem you bought it to solve has already gotten worse.
What is the ROI of deploying a workforce analytics platform for operations teams?
It shows up faster than most people expect. ProHance clients typically report productivity gains of 15–30% within the first three months.³ Beyond productivity, there’s the retention angle: every time someone leaves an operations team, you’re looking at a rehire cost of $3,500 to $5,000.⁴ Platforms that flag workforce risk early help you get ahead of attrition before it becomes a cost problem. For Philippine GCCs, being able to show parent organizations consistent, data-backed performance numbers also tends to influence how much work gets allocated to the center.
How fast can ProHance be deployed?
24 to 48 hours for setup, with full reports accessible in 72 hours.² No months-long implementation, no dedicated IT resource required, no period of flying blind while the system gets configured.
Learn how ProHance can help
Nikita Bhutani
With nearly 14 years of experience in the Learning and Development (L&D) sector, Nikita brings a wealth of knowledge and expertise to her role at ProHance. As the head of Content Strategy within the Growth & Demand Generation team, she plays a pivotal role in shaping the organization’s content initiatives. Nikita’s diverse background spans various industry segments, including BPO, IT, and BFSI, providing her with a deep understanding of the unique challenges each sector faces.
